YOUR MUSCLES FAIL BEFORE YOUR UCL DOES: THE DEEP SCIENCE OF TOMMY JOHN
The UCL doesn't blow out in isolation. It fails when the muscles protecting it can no longer do their job — whether they yield from fatigue or lock from damage. Here's exactly what happens inside the elbow, pitch by pitch.
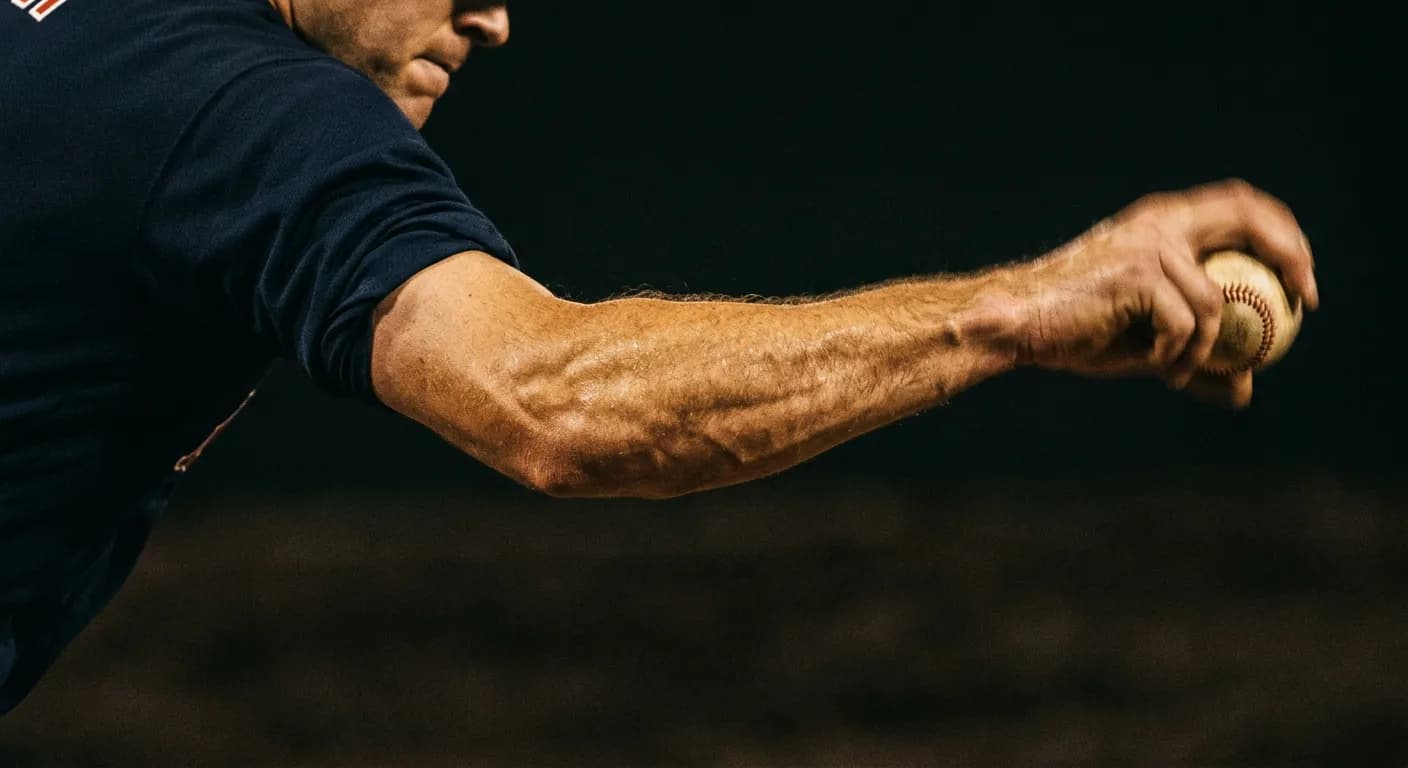
Table of Contents
- The Numbers That Should Change How You Think About Pitch Count
- Your Forearm Muscles Are Already Maxed Out
- Two Muscles, Two Opposite Failures
- Why the FCU Yields: Normal Fatigue
- Why the FDS Locks: Eccentric Microdamage
- Why a Stiffer Muscle Still Fails to Protect the UCL
- Speed of Contraction Matters More Than Strength
- Grip Strength Tells You What the Radar Gun Cannot
- The Two-Stage Model: When Your UCL Becomes Exposed
- The Damage Does Not Clear Between Starts
- The UCL Itself Gets Weaker Over a Season
- This Is Not Unique to the Elbow
- Why Getting Stronger Is Not Enough
- The Equation
You are six innings into your start. Your velocity is down a tick. The ball feels flat. Your arm is not hurt — it just is not responding the way it did in the first inning. The coaches are watching the radar gun and it says 91 instead of 93. Close enough. You stay in.
What nobody in the dugout knows — what no radar gun will ever tell you — is that the muscles protecting your UCL have been quietly failing since the third inning. The ligament is now absorbing forces it was never designed to handle alone. And the margin between "handling it" and "tearing it" is thinner than you think.
This is the post that goes deeper than the mechanics argument. That post established that tissue capacity — not arm action — is what determines whether the UCL survives. This one explains exactly how that tissue capacity degrades during a game, why two different muscles fail in two completely opposite ways, and why the damage from a single outing may last far longer than the four days between your starts.
The Numbers That Should Change How You Think About Pitch Count
The UCL fails at approximately 34 Nm of valgus torque in cadaveric testing. Multiple studies have confirmed this range — Ahmad et al. (2003) measured 34.0 +/- 6.9 Nm, McGraw et al. (2013) found 35.0 +/- 14.0 Nm, Hechtman et al. (1998) measured 22.7 +/- 9.0 Nm.
Pitching generates 45 to 120 Nm of external valgus torque at the elbow.
The force produced during a fastball exceeds the structural failure point of the ligament by 10 to 95 Nm. van Trigt et al. (2021) called this the "UCL loading paradox" — and the resolution is straightforward. The UCL does not bear the full load alone. Biomechanical models estimate the UCL, elbow muscles, and bony articulation each contribute roughly one-third of the total valgus resistance. That puts the UCL's share at approximately 33 Nm — right at its limit under single-load conditions.
But that estimate assumes the muscles are contributing their full third. The moment they stop — the moment fatigue or damage reduces their contribution even slightly — the UCL's share exceeds what it was built to handle.
 The injury equation visualized as a scale — stress applied on one side versus tissue capacity on the other, with the UCL at the fulcrum. When muscle fatigue reduces the tissue capacity side, the scale tips toward injury.
Your Forearm Muscles Are Already Maxed Out
The flexor-pronator muscles — particularly the FDS and FCU — are not casually assisting the UCL. They are running at near-maximum capacity on every single pitch.
Digiovine et al. (1992) measured EMG activity during the acceleration phase — the exact window where the UCL is most vulnerable:
| Muscle | Activation During Acceleration (% MVC) |
|---|---|
| FDS | 80% |
| FCR | 120% |
| FCU | 112% |
| Pronator Teres | 85% |
Values above 100% are possible during explosive movements because dynamic motor unit recruitment exceeds what isometric testing captures. The FCU is already operating at 112% of its measured capacity during the most dangerous phase of every pitch. There is essentially zero contractile headroom.
If fatigue reduces available peak force by even 10-15%, the muscle's contribution to valgus resistance drops meaningfully — and that load goes somewhere. It goes to the UCL.
Two Muscles, Two Opposite Failures
Here is where the science gets interesting — and where two recent studies appear to completely contradict each other.
The FCU Gets Softer
Saito, Namiki, and Okada (2021) measured the elasticity of four forearm muscles in 26 collegiate pitchers, every 15 pitches, up to 105. They used strain elastography — a method that measures how much the muscle compresses under applied pressure. Higher strain ratio means more compliant, less stiff. More give.
The FCU became significantly more compliant after 60 pitches. And the rate of that compliance increase correlated directly with how much the medial elbow joint space opened up. Pitchers whose FCU got softer lost more joint stability. Pitchers whose FCU stayed firm held up better.
The relationship was significant after 75 pitches (r = -0.395, p = 0.046), 90 pitches (r = -0.454, p = 0.020), and 105 pitches (r = -0.404, p = 0.040).
This is a clean model: muscle fatigues, gets soft, cannot resist load, joint opens, UCL takes the stress.
The FDS Locks Stiff
Mukohara et al. (2024) measured the FDS in 14 amateur pitchers using shear wave elastography — a different technique that measures absolute tissue stiffness in kilopascals. Higher kPa means stiffer.
| Time Point | FDS (kPa) | FDP (kPa) |
|---|---|---|
| Before pitching | 22.3 +/- 4.4 | 27.1 +/- 5.8 |
| After 100 pitches | 41.0 +/- 13.8 | 48.0 +/- 22.3 |
| 24 hours later | 38.3 +/- 11.2 | 29.6 +/- 11.5 |
The FDS nearly doubled in stiffness after 100 pitches. And 24 hours later, it was still significantly elevated (p = 0.0011), with no sign of returning to baseline. The FDP recovered. The FDS did not.
 FDS fatigue timeline showing stiffness nearly doubling from 22.3 kPa at baseline to 41.0 kPa after 100 pitches, remaining elevated at 38.3 kPa at 24 hours — while the FDP returns to baseline.
So which is it? Does fatigue make the tissue more compliant or more rigid?
Both. And they are describing two different muscles undergoing two fundamentally different types of failure.
Why the FCU Yields: Normal Fatigue
The FCU model is intuitive. The muscle fatigues through repetitive eccentric loading during the late cocking and acceleration phases. It progressively loses its ability to maintain contraction against valgus load. It becomes more compliant — it stretches further under the same force. Millimeter by millimeter, it yields to the valgus torque, allowing the medial elbow joint space to open.
Hattori et al. (2017) confirmed this independently: medial elbow joint space increased significantly after 60 of 100 pitches in high school players. And Okoroha et al. (2018) captured the paradox that makes this dangerous: in a simulated game of 90 pitches, medial elbow torque increased 0.84 N-m per inning after inning 3 — roughly pitch 45 — even as velocity decreased 0.28 mph per inning.
Read that again. The pitcher is throwing slower but generating more stress on the elbow. Fatigued muscles are transferring load to passive structures. The radar gun says things are fine. The elbow says they are not.
Why the FDS Locks: Eccentric Microdamage
The FDS model requires understanding what happens to muscle at the cellular level when eccentric damage crosses a threshold.
During the acceleration phase, the FDS is under extreme eccentric load. It is trying to control finger flexion on the ball while the arm whips forward — and it is simultaneously resisting valgus force at the elbow. This dual demand is unique to the FDS. Makhni et al. (2020) confirmed the FDS is not a passive bystander — contraction of the index and middle finger FDS reduced medial joint distance by 0.8 mm under valgus load, exceeding the clinical significance threshold. The muscle is actively protecting the UCL, and it is doing double duty every pitch.
That dual loading subjects it to greater eccentric stress than any other muscle in the forearm. And when the eccentric load is severe enough, it does not just fatigue the muscle. It damages it.
Proske and Morgan (2001) described the cascade:
- Sarcomere disruption. During active lengthening, the weakest sarcomeres are stretched past their myofilament overlap zone and "pop" uncontrollably
- T-tubule membrane rupture. Mechanical strain tears the T-tubule membranes connecting the cell surface to the interior
- Sarcoplasmic reticulum damage. Damage propagates to the SR — the internal calcium storage system
- Uncontrolled calcium release. Calcium floods into the muscle cell cytoplasm. This is not a contraction signal. It is an uncontrolled leak
- Contracture clots. Excess calcium triggers actin-myosin cross-bridges to lock in place involuntarily — the muscle is stuck in partial contraction
- Self-reinforcing loop. Kanzaki et al. (2022) showed that SERCA — the pump that pulls calcium back into the SR — degrades after eccentric damage. Calcium leaks out and cannot be cleaned up. More leak, more contracture, more stress on adjacent sarcomeres, more damage
This is what Mukohara measured. The FDS going from 22.3 to 41.0 kPa is not functional stiffness. It is pathological rigidity from calcium-driven contracture clots locking the cross-bridges in place.
Why a Stiffer Muscle Still Fails to Protect the UCL
This is the question that matters most. If the muscle is stiffer, should it not be better at resisting valgus load?
No. And the distinction between passive stiffness and active force generation is why.
Whitehead et al. (2001) demonstrated this directly. After 150 eccentric contractions, passive tension was significantly elevated — the tissue was measurably stiffer at rest. But peak active torque simultaneously dropped. The muscle was stiffer and weaker at the same time. This only happened after eccentric exercise, not concentric.
A dynamic stabilizer protects a ligament by rapidly generating force in response to instantaneous load. A muscle full of contracture clots is already at near-maximal cross-bridge engagement at rest. If resting engagement is at 80% because of involuntary contracture, the muscle has only 20% of its contractile capacity remaining to respond to the valgus spike. A fresh muscle at 5% resting engagement has 95% available.
The tissue is rigid, but it is the wrong kind of rigid. It is a wall that cannot flex, not a spring that can absorb.
 FDS UCL coverage diagram showing the FDS tendon overlapping 45.6% of the UCL's anterior bundle — when the FDS is locked in contracture, this extensive coverage area transmits force rigidly to the ligament instead of absorbing it dynamically.
Speed of Contraction Matters More Than Strength
Rate of force development — how fast a muscle can generate force, not just how much — is the variable that determines whether the FPMs can actually protect the UCL during the millisecond-scale valgus spike at maximum external rotation.
Penailillo, Blazevich, and Nosaka (2015) found that after eccentric exercise, RFD at the 100-200 millisecond interval decreased 24-32%. Peak torque only dropped 11-25%. RFD was 7-19% more depressed than peak strength. The muscle loses speed before it loses magnitude.
Maffiuletti et al. (2016) put it plainly: RFD is "functionally more relevant than maximal muscle strength during certain very fast actions including rapid joint stabilisation following mechanical perturbation."
A muscle that retains 80% of its peak strength but has lost 30% of its RFD is functionally unable to protect the joint during the critical window.
And here is the part that ties it together. Ando and Suzuki (2019) showed that in healthy muscle, passive stiffness positively correlates with RFD — stiffer resting muscles transmit force faster. This is why healthy baseline stiffness protects joints. But after eccentric damage, that relationship breaks. The stiffness comes from contracture clots, not healthy structural properties. It does not confer the same speed of force transmission.
When passive stiffness and RFD dissociate — stiffness up, RFD down — it signals damage and danger.
Grip Strength Tells You What the Radar Gun Cannot
If the forearm muscles are failing, there should be a measurable decline in force production during a game. There is — but velocity hides it.
Tremblay et al. (2025) measured 26 amateur pitchers across 75 pitches and found a 12.66% decline in grip strength (p < 0.001, large effect size). Forearm flexor soreness increased 153%. But velocity declined only 0.93%.
Grip strength dropped nearly 13% while velocity barely moved. A pitcher who looks fine on the radar gun may already have critically compromised forearm function. Velocity is a terrible marker of fatigue.
Erickson et al. (2024) confirmed this at the professional level with 41 minor league pitchers. Grip strength dropped from 124.5 lbs pregame to 113.1 lbs by the 4th inning. But the critical finding was the separation between pitchers who later got injured and those who did not: by the 6th inning, injured pitchers' grip strength was only 74.5% of uninjured pitchers' values. The injured group showed a steeper, more persistent decline throughout the game.
Even at the youth level — Schubert et al. (2024) showed that FCR glycogen depleted significantly in 10-year-old pitchers across just 75 pitches. Grip strength declined approximately 8% (p = 0.02). The muscles are literally running out of fuel. The ligament picks up the slack. And velocity — the number everyone is watching — is the last thing to change.
The Two-Stage Model: When Your UCL Becomes Exposed
Combining both findings, UCL protection degrades across a pitching outing in two overlapping stages:
Stage 1: Functional Fatigue (~45-75 pitches). The FDS begins losing functional stiffness around 45 pitches. The FCU follows around 60. The medial elbow joint space starts opening. Medial elbow torque rises even as velocity drops. Grip strength declines 12-13% while the radar gun barely moves. The muscles are yielding — stretching further under valgus load, transmitting progressively more force to the UCL. Manageable, but the margin is shrinking with every pitch.
Stage 2: Eccentric Microdamage (~100 pitches and beyond). By 100 pitches, the FDS has sustained enough eccentric damage to trigger calcium-driven contracture. It is passively rigid — nearly double its baseline stiffness — but has lost its ability to dynamically respond to load. Active force generation is demolished. RFD is down 24-46%. The FDS is locked, and this state persists for at least 24 hours, potentially weeks. The next outing begins with a compromised dynamic stabilizer.
At high pitch counts, both mechanisms operate simultaneously. The FCU is yielding — too compliant to resist valgus. The FDS is locked — too rigid to dynamically absorb it. Neither muscle is performing its protective role. The UCL bears the full load.
The Damage Does Not Clear Between Starts
Mukohara measured FDS stiffness at 24 hours and found it still significantly elevated. But his study ended there. The broader eccentric damage literature suggests the problem lasts far longer.
Chalchat et al. (2022) reviewed SWE studies of eccentric damage-induced stiffness and found:
| Timepoint Post-Exercise | Stiffness Increase |
|---|---|
| 1 hour | +42% to +81% |
| 24 hours | Still significantly elevated |
| 48 hours | +39% |
| 14 days | Still elevated above baseline |
| 21 days | +14% still persisting |
These are measurements from other muscle groups after eccentric protocols, not specifically the FDS after pitching. But the mechanism is the same — calcium-driven contracture from eccentric damage — and the timelines are consistent.
A pitcher on 4 or 5 days rest after a high-pitch-count outing may still be throwing with an FDS that has not recovered. He enters his next start with a compromised dynamic stabilizer before throwing a single pitch. His fatigue threshold is lower. His UCL exposure begins earlier. And if this compounds over multiple starts — which it almost certainly does — the cumulative exposure builds across a season.
The UCL Itself Gets Weaker Over a Season
The fatigue model becomes even more alarming when you consider that the UCL is not maintaining the same strength from spring training to October.
Gupta et al. (2023) measured shear wave velocity in the UCL of 17 collegiate pitchers across a competitive season. The proximal UCL — the region that fails most often — showed a significant decrease in shear wave velocity from preseason to midseason (-1.55 m/s, p = 0.001). Lower SWV means softer tissue. The ligament itself was becoming mechanically weaker.
And it did not fully recover. Postseason measurements still showed proximal SWV depressed by -1.13 m/s (p = 0.015).
So across a season, you have a ligament getting progressively softer while the muscles protecting it accumulate fatigue damage that may not fully clear between starts. A weaker ligament absorbing more load because fatigued muscles contribute less. Every start.
Shanley et al. (2018) put a clinical number on where this ends. In 70 asymptomatic professional pitchers followed for one season, gapping of 5.6 mm or greater predicted a 6-fold increase in UCL tear risk (p = 0.02). That is the same threshold Saito's data shows is approached through muscle fatigue-driven joint space opening during a single game.
This Is Not Unique to the Elbow
The model — muscle fatigue reducing dynamic stabilization and increasing ligament loading — has been demonstrated at other joints.
Wojtys, Wylie, and Huston (1996) fatigued the quadriceps and hamstrings and measured the effect on anterior tibial translation — the knee equivalent of medial elbow gapping. Translation increased by an average of 32.5%. Melnyk and Gollhofer (2007) showed it does not even take maximal fatigue — submaximal hamstring fatigue was sufficient to impair the protective reflex arc.
And the failure extends beyond force production. Mohammadi et al. (2024) found that fatigue impairs proprioception — athletes become worse at detecting joint position. The muscles responsible for dynamic stabilization also supply the proprioceptive information needed to activate that stabilization. Fatigue compromises both the sensor and the effector. You cannot protect what you cannot feel.
Why Getting Stronger Is Not Enough
If muscle fatigue is what exposes the UCL, the instinct is to make the muscles stronger. That instinct is partially correct — but the type of strength matters enormously.
Lopez et al. (2025) studied an 8-week forearm strengthening program in 14 NCAA pitchers. Grip strength increased (p = 0.05). Forearm girth increased (p = 0.01). The muscles got bigger and stronger. But medial elbow gapping under valgus stress did not decrease (p = 0.15). Static hypertrophy did not translate to dynamic joint protection.
The muscles need to generate force fast enough to respond to a millisecond-scale valgus spike. Training that builds peak strength without training the speed of contraction is training the wrong quality.
But eccentric conditioning specifically offers a protective mechanism through the repeated bout effect. Mavropalias et al. (2019) showed that after an initial bout of eccentric exercise, a second bout 28 days later produced dramatically reduced damage markers — creatine kinase "did not differ from baseline at any time." The inflammatory cascade that drives the contracture clot mechanism was essentially eliminated.
If pitchers systematically expose the FDS and FCU to progressive eccentric loading during training, the repeated bout effect should reduce the damage from each subsequent high-intensity outing. Less damage means less calcium-driven contracture, faster recovery of active force capacity, and more starts where the FDS enters the game at full function.
The critical limitation: the repeated bout effect suppresses secondary damage, not primary mechanical fatigue within a game. Pitch count management and adequate rest between outings remain essential even for the best-conditioned forearms in baseball.
The Equation
The UCL does not fail in isolation. It fails when the muscles that protect it can no longer do their job — whether they yield from fatigue or lock from damage.
Every pitch degrades the system. The FCU gets softer. The FDS gets locked. The joint opens. The torque rises. The ligament absorbs what the muscles used to absorb. And if the pitcher goes back out before the damage clears — if the FDS is still at 38 kPa when it should be at 22 — he starts the next game already behind.
Velocity will not tell you this is happening. Grip strength will. Tissue stiffness measurements will. But radar guns and pitch counts — the two numbers baseball has decided to monitor — are the least sensitive markers of the system that actually determines whether the UCL survives.
If you are a pitcher dealing with medial elbow symptoms, velocity decline that does not recover between starts, or a dead arm that keeps coming back despite rest — the problem may not be workload. It may be tissue capacity that was never built, or damage that was never given time to clear. That is what we assess — data-driven evaluation of the structures that actually determine whether your UCL holds up, not a guess based on your arm action or your pitch count.
Reach out. The UCL has a budget. The muscles are the ones spending it. When the muscles run out of credit, the ligament pays the bill.
THE NEXT STEP
See how forearm capacity, workload management, and arm-health testing fit into a prevention plan.
Explore Pitching Injury PreventionReady to talk? Book a free consultation →
RELATED POSTS
Dead Arm in Baseball: Four Causes, One Nobody Catches
"Dead arm" is not one thing. It's four different problems — and the most underdiagnosed one is caused by a coaching cue every pitcher has heard.
Read More →
Better Mechanics Won't Save Your UCL: Here's Why
"Fix his mechanics" is baseball's most common advice, and a logical fallacy. The research says tissue capacity and workload are what actually matter.
Read More →
Why Data-Driven Throwing Rehab Gets Better Results
Hope is not a return-to-throw strategy. Feel-based rehab ignores the metrics that predict re-injury. Here is what data-driven rehab actually tracks.
Read More →